This time we’re working on comparing four different elevation sources for a particular area in southeastern Utah. The goal is to observe/”equalize” the four datasets in the same area so that we can see what differences are present and what implications they might have for future analysis. For clarity below a 10m DEM means that each pixel in the image represents a 10m x 10m area on the ground, 30m DEM = 30m x 30m, etc.)
I’ve placed the above comparison images in sliders from what might seem to be moving from “worst” to “best” data. From 30m up to 0.5m might lead us to think that the 0.5 m data is the best/most precise/most accurate/highest resolution, etc. At least that’s what I might’ve thought if looking at those numbers alone. But there is more here than just the numbers.
Digging into the source of our elevation products, we find things to be a bit more nuanced:
| 10m DEM – USGS | Variety of Sources, including historical contour data |
| 30m DEM – USGS | Variety of Sources including historical contour data |
| 5m Photogrammetry Derived DEM | Photos are taken during full-canopy of vegetation |
| 0.5m Lidar Elevation Data | In this case, bare-earth return from Lidar |
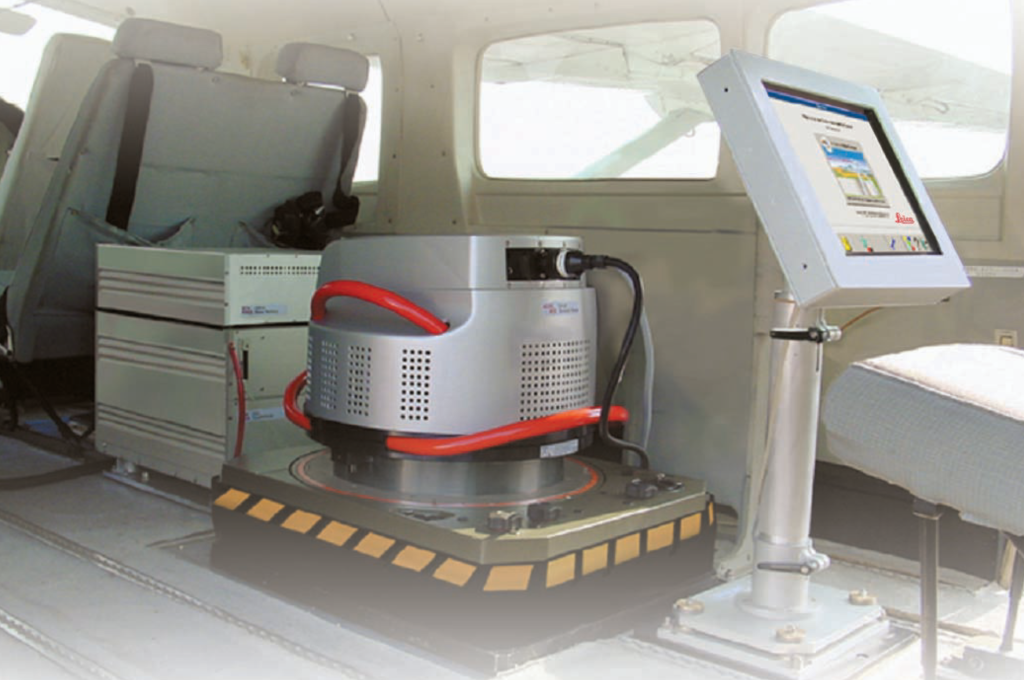
Two of these data sources are distinctly different from each other in terms of vegetation, the 5m and 0.5m. Elevation will definitely be affected when comparing things in the mountainous region we’re focused on if trees, bushes, and other vegetation are included in that elevation in some data, but not included in others. To get the most accurate actual relative elevation data of the earth, in my understanding the best place to start would be bare-earth lidar return data.
To gather this lidar data, a more precise/expensive sensor is needed, and it can be even more time-intensive to perform the data gathering than with other methods. So what do we get between the other three data sources? The two USGS data sets are somewhat easy to compare straight across – if we have 10m data, that will be superior to the 30m data, based on resolution alone. But what conclusion can we draw between the 10m data and the 5m photogrammetry derived data?
At this point, I think another direct comparison slider image can be very helpful.
As a budding GIS learner, my supposition here is that the creek and surrounding ravine areas would carry snow run-off/water from the nearby peaks, at least seasonally. This would increase the chance that vegetation might grow more thickly surrounding the creek/water areas. This would in turn mean that the photogrammetry derived imagery (taken in full canopy) would be very likely to incorrectly return elevation data in that area that shows nearly zero evidence of the presence of those creekbeds. If it wasn’t labeled and named on the map, you might not even know it was there if looking only at the 5m data. However, our 10m data, while being a “worse” number in terms of resolution, must have been sourced with data gathering of some type that worked irrespective of vegetation (perhaps gathered at a time of the year when full-canopy was not present). This worked in its favor and allows for better observation of the creek bed and related ravines.
What other observations can be made about the differences in these data types and the effect that has on further analysis?